REGIONAL ANALYSIS OF LOUISVILLE KENTUCKY MSA
Regional Analysis:
Three Types of Statistical Areas:
The statistical areas of the United States of America comprise the metropolitan statistical areas (MSAs), the micropolitan statistical areas and the combined statistical areas currently defined by the United States Office of Management and Budget (OMB).
Combined Statistical Areas (CSAs):
Combined statistical area is a United States Office of Management and Budget term for a combination of adjacent metropolitan and micropolitan statistical areas in the United States and Puerto Rico that can demonstrate economic or social linkage. The OMB defines a CSA as consisting of various combinations of adjacent metropolitan and micropolitan areas with economic ties measured by commuting patterns. These areas that combine retain their own designations as metropolitan or micropolitan statistical areas within the larger combined statistical area.
Metropolitan Statistical Areas (MSAs):
In the United States, a metropolitan statistical area is a geographical region with a relatively high population density at its core and close economic ties throughout the area. Such regions are neither legally incorporated as a city or town would be, nor are they legal administrative divisions like counties or separate entities such as states; because of this, the precise definition of any given metropolitan area can vary with the source. The statistical criteria for a standard metropolitan area were defined in 1949 and redefined as metropolitan statistical area in 1983. A typical metropolitan area is centered on a single large city that wields substantial influence over the region. However, some metropolitan areas contain more than one large city with no single municipality holding a substantially dominant position. MSAs are defined by the U.S. Office of Management and Budget and used by the Census Bureau and other federal government agencies for statistical purposes.
Micropolitan Statistical Areas:
The OMB defines a Micropolitan Statistical Area as one or more adjacent counties or county equivalents that have at least one urban core area of at least 10,000 population but less than 50,000, plus adjacent territory that has a high degree of social and economic integration with the core as measured by commuting ties.
Primary Statistical Areas:
The subject is influenced in a general manner by the economic, political, physical and social characteristics of the Louisville-Jefferson County-Elizabethtown-Madison, Kentucky-Indiana (CSA) and Louisville-Jefferson County, Kentucky-Indiana (MSA).
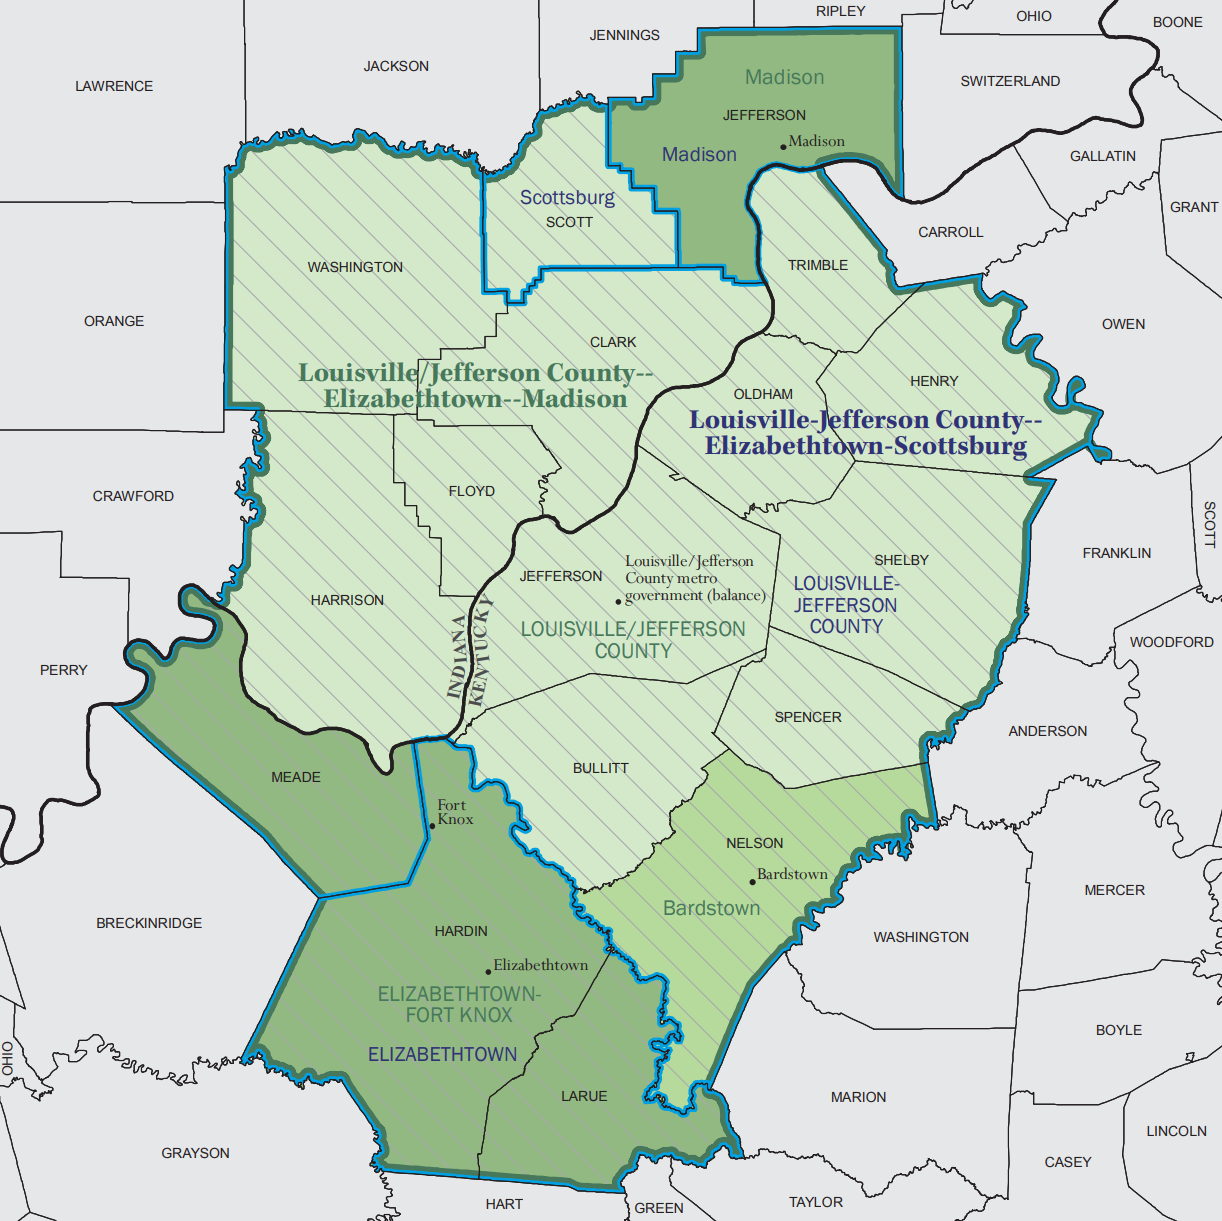
A map of the Louisville-Jefferson County-Elizabethtown-Madison, Kentucky-Indiana (CSA) is presented below:

Louisville MSA Boundaries, and Other Relevant Areas:
Aside from the Louisville MSA, the subject is also influenced in a general manner by the economic, political, physical and social characteristics of the Elizabethtown-Fort Knox, KY (MSA), Bardstown, KY, and Madison, IN.
A map of the Louisville-Jefferson County, Kentucky-Indiana (MSA) is presented below:
The Louisville-Jefferson County, Kentucky-Indiana (MSA) is shown in green.
The Elizabethtown-Fort Knox, KY (MSA) is shown in orange.
The Bardstown, KY area is shown in blue.
Louisville-Jefferson County, Kentucky-Indiana (MSA):
The Louisville metropolitan area or Kentuckiana, also known as the Louisville-Jefferson County, Kentucky-Indiana, metropolitan statistical area, is the 45th largest metropolitan statistical area (MSA) in the United States. The principal city is Louisville, Kentucky.
It was originally formed by the United States Census Bureau in 1950 and consisted of the Kentucky county of Jefferson and the Indiana counties of Clark and Floyd. As surrounding counties saw an increase in their population densities and the number of their residents employed within Jefferson County, they met Census criteria to be added to the MSA. Jefferson County, Kentucky (contiguous with Louisville Metro), plus eleven outlying counties – seven in Kentucky and five in Southern Indiana – are now a part of this MSA. One other Kentucky county was part of the MSA in the 2000 and 2010 U.S. Censuses, but was spun off by the Census Bureau into its own Micropolitan Statistical Area in 2013.
People living in any portion of the MSA are said to be living in the Louisville-Jefferson County Area. Because it includes counties in Indiana, the MSA (or a large portion thereof) is regularly referred to as Kentuckiana. It is now the primary MSA of the Louisville-Jefferson County-Elizabethtown-Madison, Kentucky-Indiana combined statistical area (or Louisville CSA, which adds Hardin County, Kentucky, LaRue County, Kentucky, Jefferson County, Indiana, and Nelson County, Kentucky). The combined statistical area created by the United States Bureau of the Census in 2000 and most recently redefined in 2013 comprises the Louisville-Jefferson County MSA, the Elizabethtown-Fort Knox, Kentucky, MSA, the Bardstown, Kentucky, micropolitan statistical area and the Madison, Indiana micropolitan statistical area.
Area History:
Louisville is the largest city in the Commonwealth of Kentucky and the 29th most-populous city in the United States. It is one of two cities in Kentucky designated as first-class, the other being Lexington, the state’s second-largest city. Louisville is the historical seat and, since 2003, the nominal seat of Jefferson County, on the Indiana border.
Named after King Louis XVI of France, Louisville was founded in 1778 by George Rogers Clark, making it one of the oldest cities west of the Appalachians. With nearby Falls of the Ohio as the only major obstruction to river traffic between the upper Ohio River and the Gulf of Mexico, the settlement first grew as a portage site. It was the founding city of the Louisville and Nashville Railroad, which grew into a 6,000-mile system across 13 states. Louisville lies along the Ohio River, is located approximately 300 miles south of Chicago. The city is situated geographically within the United States such that it is often referred to as either the northernmost Southern city, or the southernmost Northern city. The Louisville metropolitan area is even considered part of the Great Lakes Megalopolis.
In the post-revolutionary U.S., Louisville was an important western outpost. Situated at the Falls of the Ohio, Louisville became a key port for the western frontier. Similar to its inland-port contemporaries, such as Cincinnati and St. Louis, Louisville had an industrial river economy in the beginning; growth was driven by heavy manufacturing, shipping and trade. Louisville also gained attention for its bourbon whiskey, Louisville Slugger baseball bats and Kentucky Derby, cultural hallmarks that live strong today.
Postwar Louisville saw a movement away from heavy manufacturing and away from river trade, as production processes and labor needs changed across the country. Coupled with deurbanization and population loss, Louisville’s economic transition was typical of that of industrial cities. Atypical was Louisville’s ease of adapting to a modern postindustrial service economy.
As it stands today, the city is a particularly strong hub for the healthcare and foodservice industries. Logistics and distribution, as well as recently expanding manufacturing, are other industries of note. This economic transition also helped dampen urban population loss experienced in similar cities and even helped garner healthy population growth in recent years.
Today, the city is known as the home of legendary boxer Muhammad Ali, the Kentucky Derby, Kentucky Fried Chicken (KFC), the University of Louisville and its Cardinals, Louisville Slugger baseball bats, and three of Kentucky’s six Fortune 500 companies: Humana, Kindred Healthcare, and Yum! Brands. Muhammad Ali International Airport, Louisville’s main commercial airport, hosts UPS’s worldwide hub.
Since 2003, Louisville’s borders have been the same as those of Jefferson County, after a city-county merger. The official name of this consolidated city-county government is the Louisville/Jefferson County Metro Government, abbreviated to Louisville Metro. Despite the merger and renaming, the term “Jefferson County” continues to be used in some contexts in reference to Louisville Metro, particularly including the incorporated cities outside the “balance” which make up Louisville proper.
Social Trends, Economic Circumstances, Environmental Conditions, and Governmental Controls and Regulations:
The value of real property is influenced by the interaction of four basic forces. These forces include social trends, economic circumstances, environmental conditions, and governmental controls and regulations. The interaction of these four forces influences the value of every parcel of real estate in the market. The tables and charts presented throughout the following pages include additional data that help tell the story about Louisville’s economy.
Social Trends, State and MSA Population:
Social forces are trends that are exerted primarily through population characteristics. Real property values are affected not only by population changes and characteristics, but also by various forms of human activity.
Population growth trends influence employment growth, income levels, and many other key demand parameters analyzed in determining commercial real estate productivity.
Recently released population estimates from the Census document how much Kentucky has continued to urbanize over the last seven years. Not surprisingly, rural eastern and western counties’ populations have dropped while the “golden triangle” and the area around Bowling Green grew. Overall, between 2010 and 2017, Kentucky grew by an estimated 106,240 people or 2.4 percent. But that growth was dramatically lopsided toward growth in urban areas.
By percent, the counties (all rural) that saw the largest loss of population between 2010 and 2017 were Lee (-14.9 percent), Martin (-11.3 percent), Pike (-9.5 percent), Floyd (-9.2 percent), and Fulton (-9.0 percent). The counties (all urban) that saw the largest percent growth were Scott (+15.9 percent), Warren (+12.7 percent), Shelby (+12.2 percent), Oldham (+9.9 percent), and Jessamine (+9.6 percent). When looking at the number of people who left counties, Pike had by far the greatest decline with 6,190 fewer residents. Unsurprisingly, Jefferson and Fayette counties saw the largest growth with 29,140 and 25,260 more people respectively. Even though the total Kentucky population grew by 106,240 people, the growth in urban counties was 118,450, or 4.7 percent, while the population dropped 12,210, or -0.7 percent, in rural counties between 2010 and 2017.
The national trend of urbanization is longstanding, but the hastening decline of coal and certain types of manufacturing jobs in Kentucky are almost certainly contributing to the decline in some rural counties’ populations. In fact, since the Great Recession, job gains have been concentrated almost exclusively in urban and suburban areas, the same areas that have seen the lion’s share of Kentucky’s population growth. These trends raise concerns about the impending requirement that Medicaid enrollees meet a certain number of hours of work activities or else lose coverage and the similar requirement for food assistance that is currently being reinstated. As distressed rural economies shrink, job opportunities also contract leaving people unable to fulfill these requirements and keep health care and food assistance. In turn, fewer people with health coverage and help at the grocery store will take important resources out of these communities, very likely causing job losses in health care and grocery stores but also in other sectors.
The shrinking population in rural counties also presents a problem for local governments for whom the tax base dwindles even as the need to invest in good schools and roads remains.
Louisville-Jefferson County, Kentucky-Indiana (MSA) Population Growth Trends:
The Louisville-Jefferson County, Kentucky-Indiana (MSA), as forecasted by Proximity One, is projected to grow by approximately 26%, between 2010 and 2040. By 2035 the Louisville-Jefferson County, Kentucky-Indiana (MSA) is projected to top 1.5 million people. Jefferson County is forecast to experience the largest numeric gain over the projection period, accounting for 42% of the predicted growth in the MSA.
The Louisville-Jefferson County, Kentucky-Indiana (MSA), as forecasted by the University of Louisville, utilizing the Kentucky State Data Center, shows the MSA has experienced steady growth, and population growth tends to be a positive indicator for real estate values. The University of Louisville forecasts this population increase into 2050, and has a higher population estimate for 2035 at closer to 1.6 million, as opposed to Proximity One’s 1.5 million+ estimate.
Two graphics illustrating the pertinent points of the two population forecasts by Proximity One and the University of Louisville are presented below, with dark red on the left being the highest change, and dark red on the right being highest percentage change:


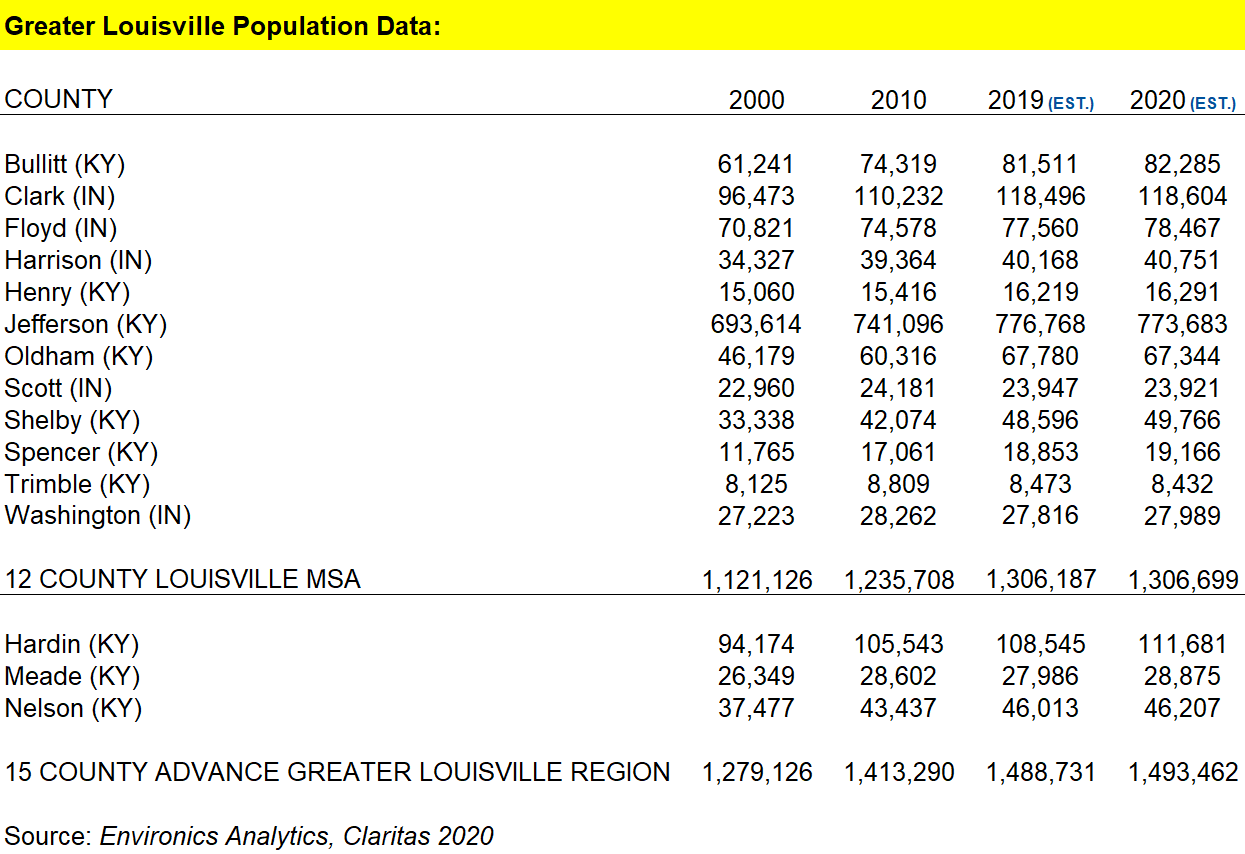
The Louisville-Jefferson County, Kentucky-Indiana (MSA) includes Louisville-Jefferson County and 11 surrounding counties, seven in Kentucky and five in Southern Indiana. As of 2018, the MSA had a population ranking of 45th nationally. The individual population, and population estimate figures for those 12 counties, and an additional three that make up the 15-County Louisville-Jefferson County-Elizabethtown-Madison, Kentucky-Indiana (CSA) is presented as follows:
Economic Forces:
Economic forces are the fundamental relationships between current and anticipated supply and demand and the economic activities in which the population participates in order to satisfy its wants, needs, and demands through its purchase power.
Within the MSA, Jefferson County is the primary county and should continue to experience growth in the professional sector grouping, the health care and social assistance sector, transportation and warehousing, and hospitality/tourism. Manufacturing remains a question. Most analysts believe that manufacturing employment will reach some “floor” and remain relatively constant around that floor for the future.
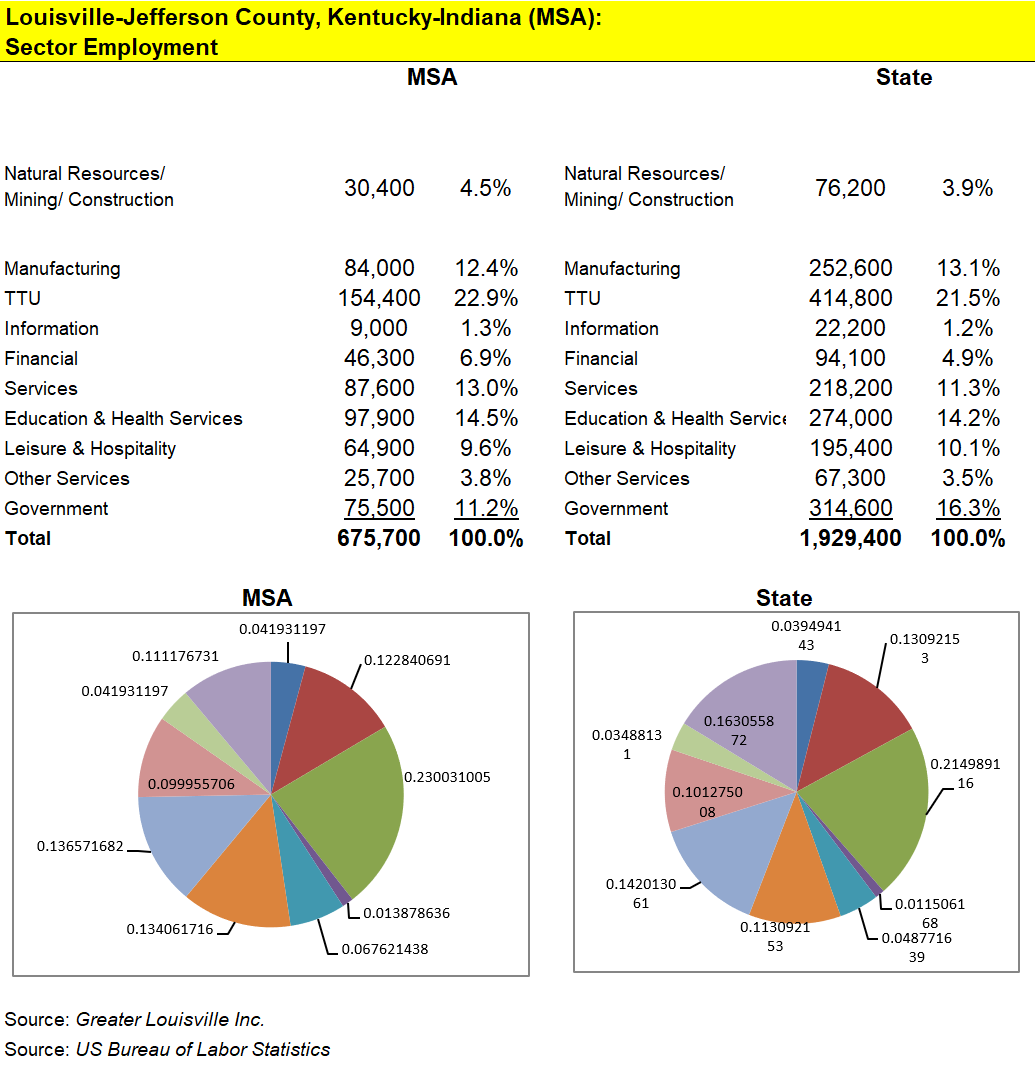
The chart below indicates the employment by sector for both the state and the MSA per the US bureau of labor. As shown the overall employment composition for both the MSA and state are similar and diverse indicating a stable economic base.
Industries:
The major employers of Louisville are consistent with the sector employment shown previously. The chart below lists the 29 largest private employers. It is noted that the government and school systems make up a large component of the area employment.
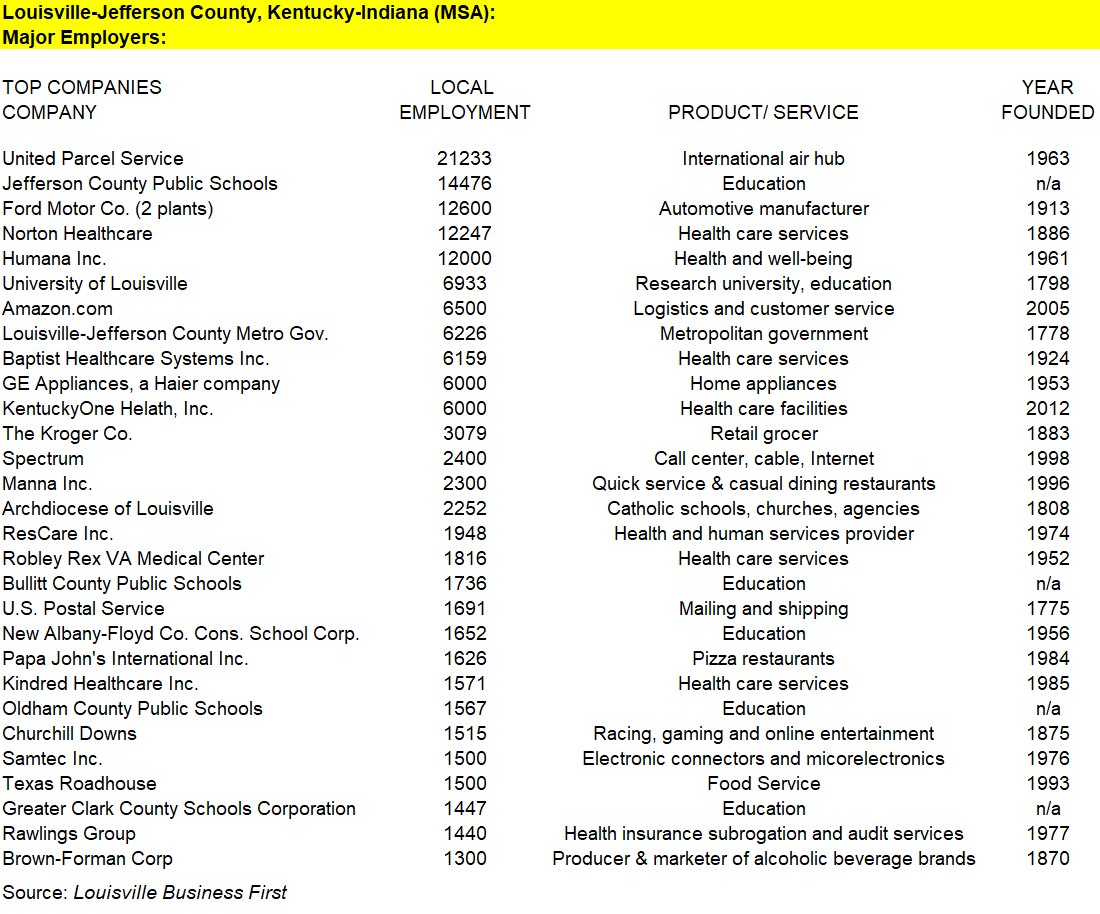
Along with a vibrant entrepreneurial climate, the region has a diversified economy with an emphasis in the sectors surrounding health, logistics, manufacturing, food and beverage, and business services. It is also significant that 95% of the world’s bourbon is made in Kentucky.
Higher Education:
Institutions of higher learning typically are not as vulnerable to economic downswings, and they help to provide an area with a more solid employment base. Noted universities and colleges in Metro Louisville are the University of Louisville, Jefferson Community College, Sullivan University network, Bellarmine University, Louisville Technical Institute, Louisville Presbyterian Theological Seminary, Spalding University, Indiana University Southeast, and Indiana Vocational Technical School.
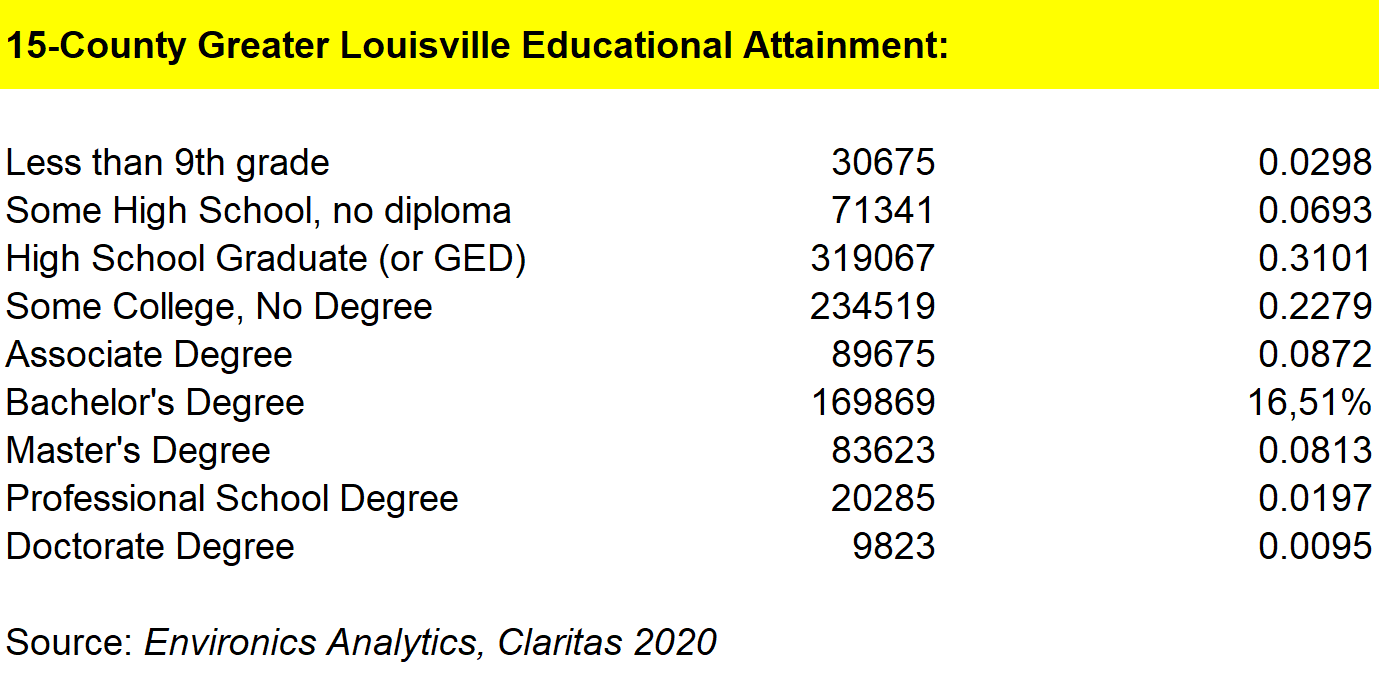
The 15-County Greater Louisville Educational Attainment for 2020 estimated population over 25, as compiled by Claritas, is presented below.
Transportation:
Highway accessibility is a primary consideration in planning an area’s future growth and development. The Louisville metropolitan area is accessed via three different interstate highways. I-64 is a major east-west corridor, capable of delivering goods to the East or West Coasts. St. Louis lies to the west on I-64; West Virginia is accessible to the east. I-65 is a major north-south corridor, connecting Louisville with Indianapolis, IN and Chicago to the north, and Nashville, TN and Montgomery, AL to the south. I-71 is a regional interstate highway that connects Louisville with Cincinnati, OH, as well as I-75, which services not only major points in Ohio but all major points between Detroit, MI and Florida. Regionally, Indianapolis, Cincinnati, and Nashville are all within a three-hour drive.
Louisville’s central location in the eastern United States, gives it the claim that over 50% of the United States Population can be reached within a one-day drive. This makes Louisville and ideal location for distribution.
Louisville’s main airport is the centrally located Louisville International Airport, whose IATA Airport Code (SDF) reflects its former name of Standiford Field. The airport is also home to UPS’s Worldport global air hub. UPS operates its largest package-handling hub at Louisville International Airport and bases its UPS Airlines division there. Over 3.5 million passengers and over 3 billion pounds (1,400,000 t) of cargo pass through the airport each year. Louisville International Airport is also the 4th busiest airport in the United States when in cargo passage, and it is the 11th busiest in cargo passage in the world.
The Ohio River provides an avenue for water transportation, which includes a considerable amount of barge traffic. The Ohio River connects with the Mississippi River in St. Louis to the west and the Allegheny River in Pittsburgh, PA to the east.
Public transportation consists mainly of buses run by the Transit Authority of River City (TARC). The city buses serve all parts of downtown Louisville and Jefferson County, as well as Kentucky suburbs in Oldham County, Bullitt County, and the Indiana suburbs of Jeffersonville, Clarksville and New Albany.
Louisville is served by two major freight railroads, CSX (with a major classification yard in the southern part of the metro area) and Norfolk Southern. Five major main lines connect Louisville to the rest of the region. Two regional railroads, the Paducah and Louisville Railway and the Louisville and Indiana Railroad, also serve the city.
Governmental Forces & Incentives:
Governmental, political and legal actions at all levels have an impact on property values. The legal climate of a particular time or in a particular place may overshadow the natural market forces of supply and demand.
In terms of taxes, Kentucky has recently enacted wide-spread reforms to tax code policy. Reforms include the repeal of the corporate license tax and the intangible property tax, as well as a reduction in the corporate income tax rate from 8.25 percent to the current 6%. Personal income taxes have also been reduced to a range of 2-6%. Indiana ranks 8th in Tax Foundation’s 2015 Business Tax Climate Index. The cost of doing business in Indiana is very favorable, due in part to having one of the best workers’ compensation rates and unemployment tax rates. Due to legislation passed this year, corporate tax for Indiana is set to drop from 7% to 4.9% by 2021.
Kentucky Tax Incentives:
In terms of financial incentives, benefits are available for all types of companies – new, existing and relocating; regional and national headquarters; back-office; distribution and supply chain; manufacturing; and research and development. Both Indiana and Kentucky have generous business incentives and financial programs. Incentives for both Kentucky and Indiana counties are executed at the state level. The local community in which the business will locate will engage the state representatives and facilitate the execution of the incentives. The Kentucky Business Investment (KBI) program provides income tax credits and wage assessments to new and existing agribusinesses, regional and national headquarters, manufacturing companies, and non-retail service or technology related companies that locate or expand operations in Kentucky. The Kentucky Enterprise Initiative Act (KEIA) program provides for new or expanded service or technology, manufacturing, or tourism attraction project in Kentucky.
Indiana Tax Incentives:
The Economic Development for a Growing Economy (EDGE) Tax Credit provides incentive to businesses to support jobs creation, capital investment and to improve the standard of living for Indiana residents. The Hoosier Business Investment Tax Credit (HBITC) provides incentive to businesses to support jobs creation, capital investment and to improve the standard of living for Indiana residents. The Skills Enhancement Fund (SEF) Provides assistance to businesses to support training and upgrading skills of employees required to support new capital investment. There are more incentives offered by the states, and a more comprehensive list is available from the Greater-Louisville website.
Outlook:
Our review of the above data indicates that the Louisville MSA has historically enjoyed a relatively stable economy, evidenced by a historical pattern of increasing income levels, a steady creation of new jobs, and relatively low unemployment rates.
In conclusion, the economic outlook for the Metro Louisville MSA is favorable for the short and long-term overall success of the subject. The economic trends in the Louisville/Jefferson County, KY-IN (MSA) suggest that investment and economic activity is increasing and should continue to do so into the future.

